
")
OpenAI just released Code Interpreter. It allows you to execute Python code within a live working environment. One of the things that it allows us to do is take data files and conduct data analysis and create graphs and charts.
Not knowing what that meant I decided to play with it. So I found a publicly available database on wine quality (and why not? Don’t give me that look) and imported it into Code Interpreter. I am not including the entire conversation I had with GPT but provide some key excerpts below. You can read the entire interaction in this linked pdf document.
So I started with a complete blank slate. I had no idea what I was doing. So I started the conversation with:
Can you create some interesting data visualizations based on this dataset?
After looking over the data, it suggested the following:
For instance, we can examine the distribution of quality ratings for both types of wine, the correlation between different properties and the quality of the wine, and some other interesting relationships. Does that sound good to you?
And once I said yes, within seconds I had the following diagram, with the explanation below.
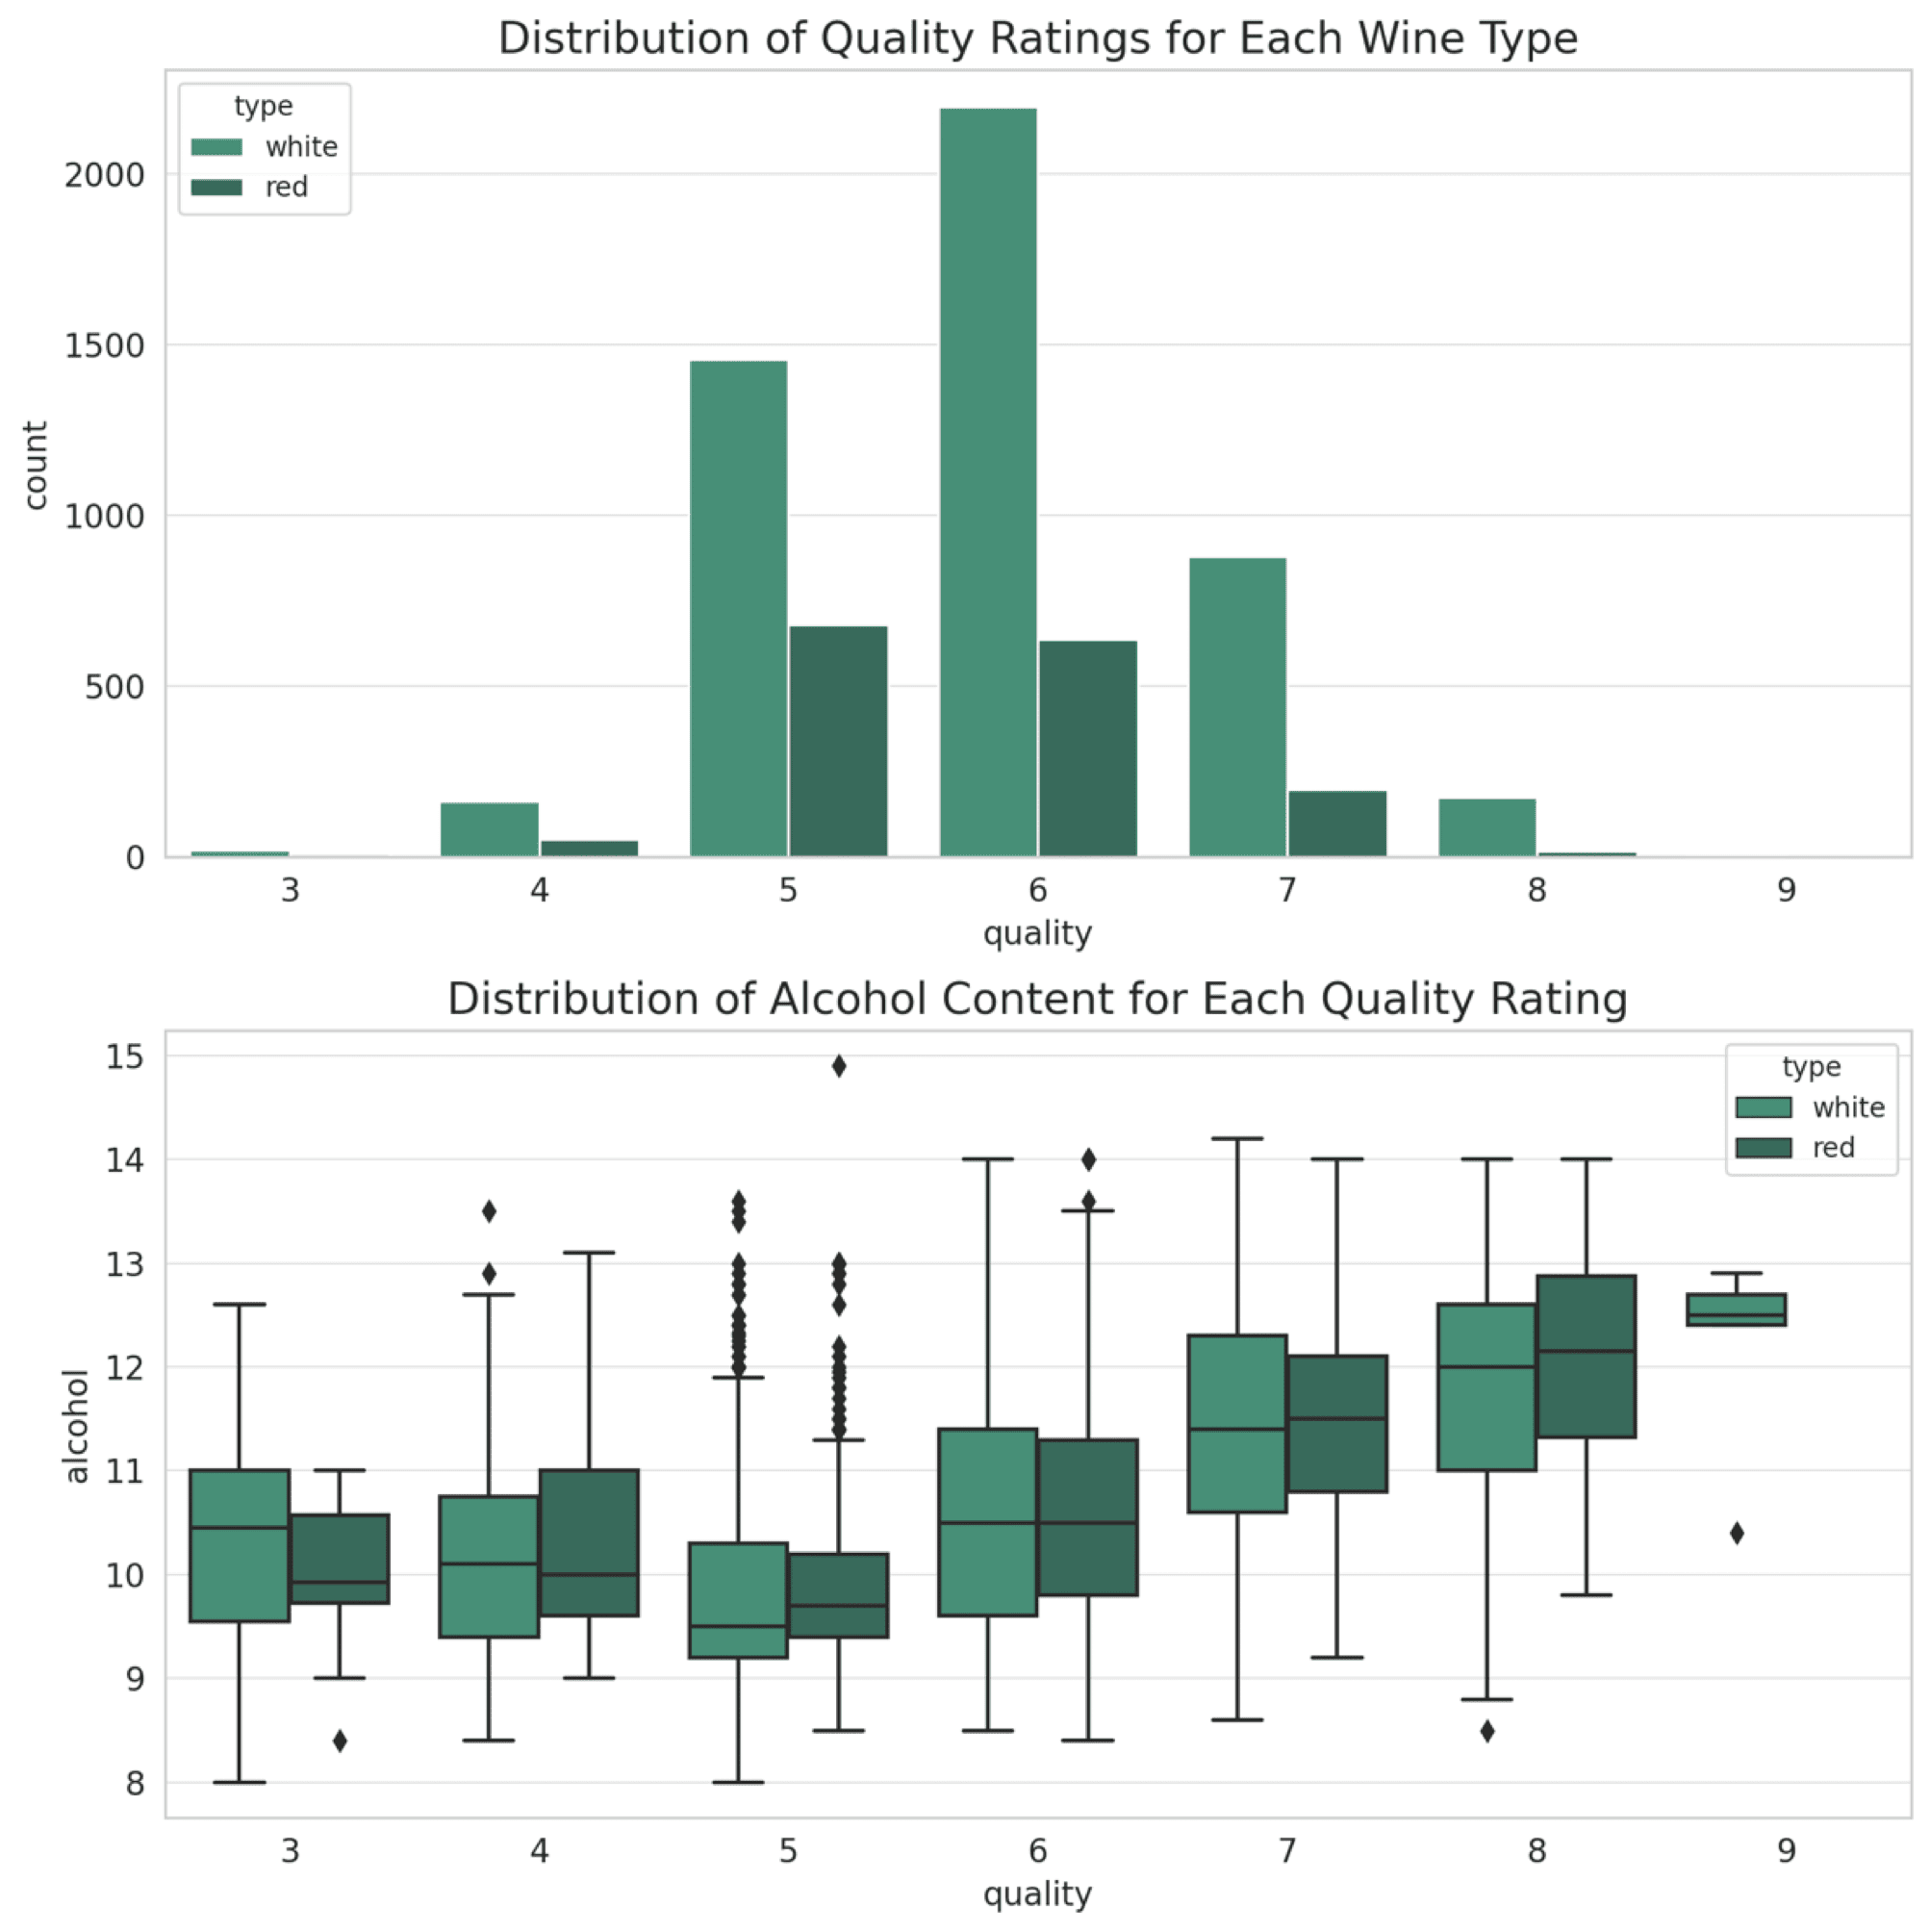
In the first plot, “Distribution of Quality Ratings for Each Wine Type,” we can see that the majority of wines, both red and white, have a quality rating of 5, 6, or 7. White wine tends to have slightly higher quality ratings overall compared to red wine. In the second plot, “Distribution of Alcohol Content for Each Quality Rating,” we see that higher-quality wines generally contain more alcohol. This is true for both red and white wines. The trend suggests that wines with higher alcohol content tend to be rated better in quality.
Hmmm… wines with higher alcohol content tend to be rated higher! Why am I not suprised 🙂
Not sure of what to do next, I wrote:
I am interested in some cool visualizations that can emerge from this analysis. What would you suggest?
After a bit of back and forth, where it provided me with a variety of options, I asked it to create a correlational heatmap. Within seconds I had the following.
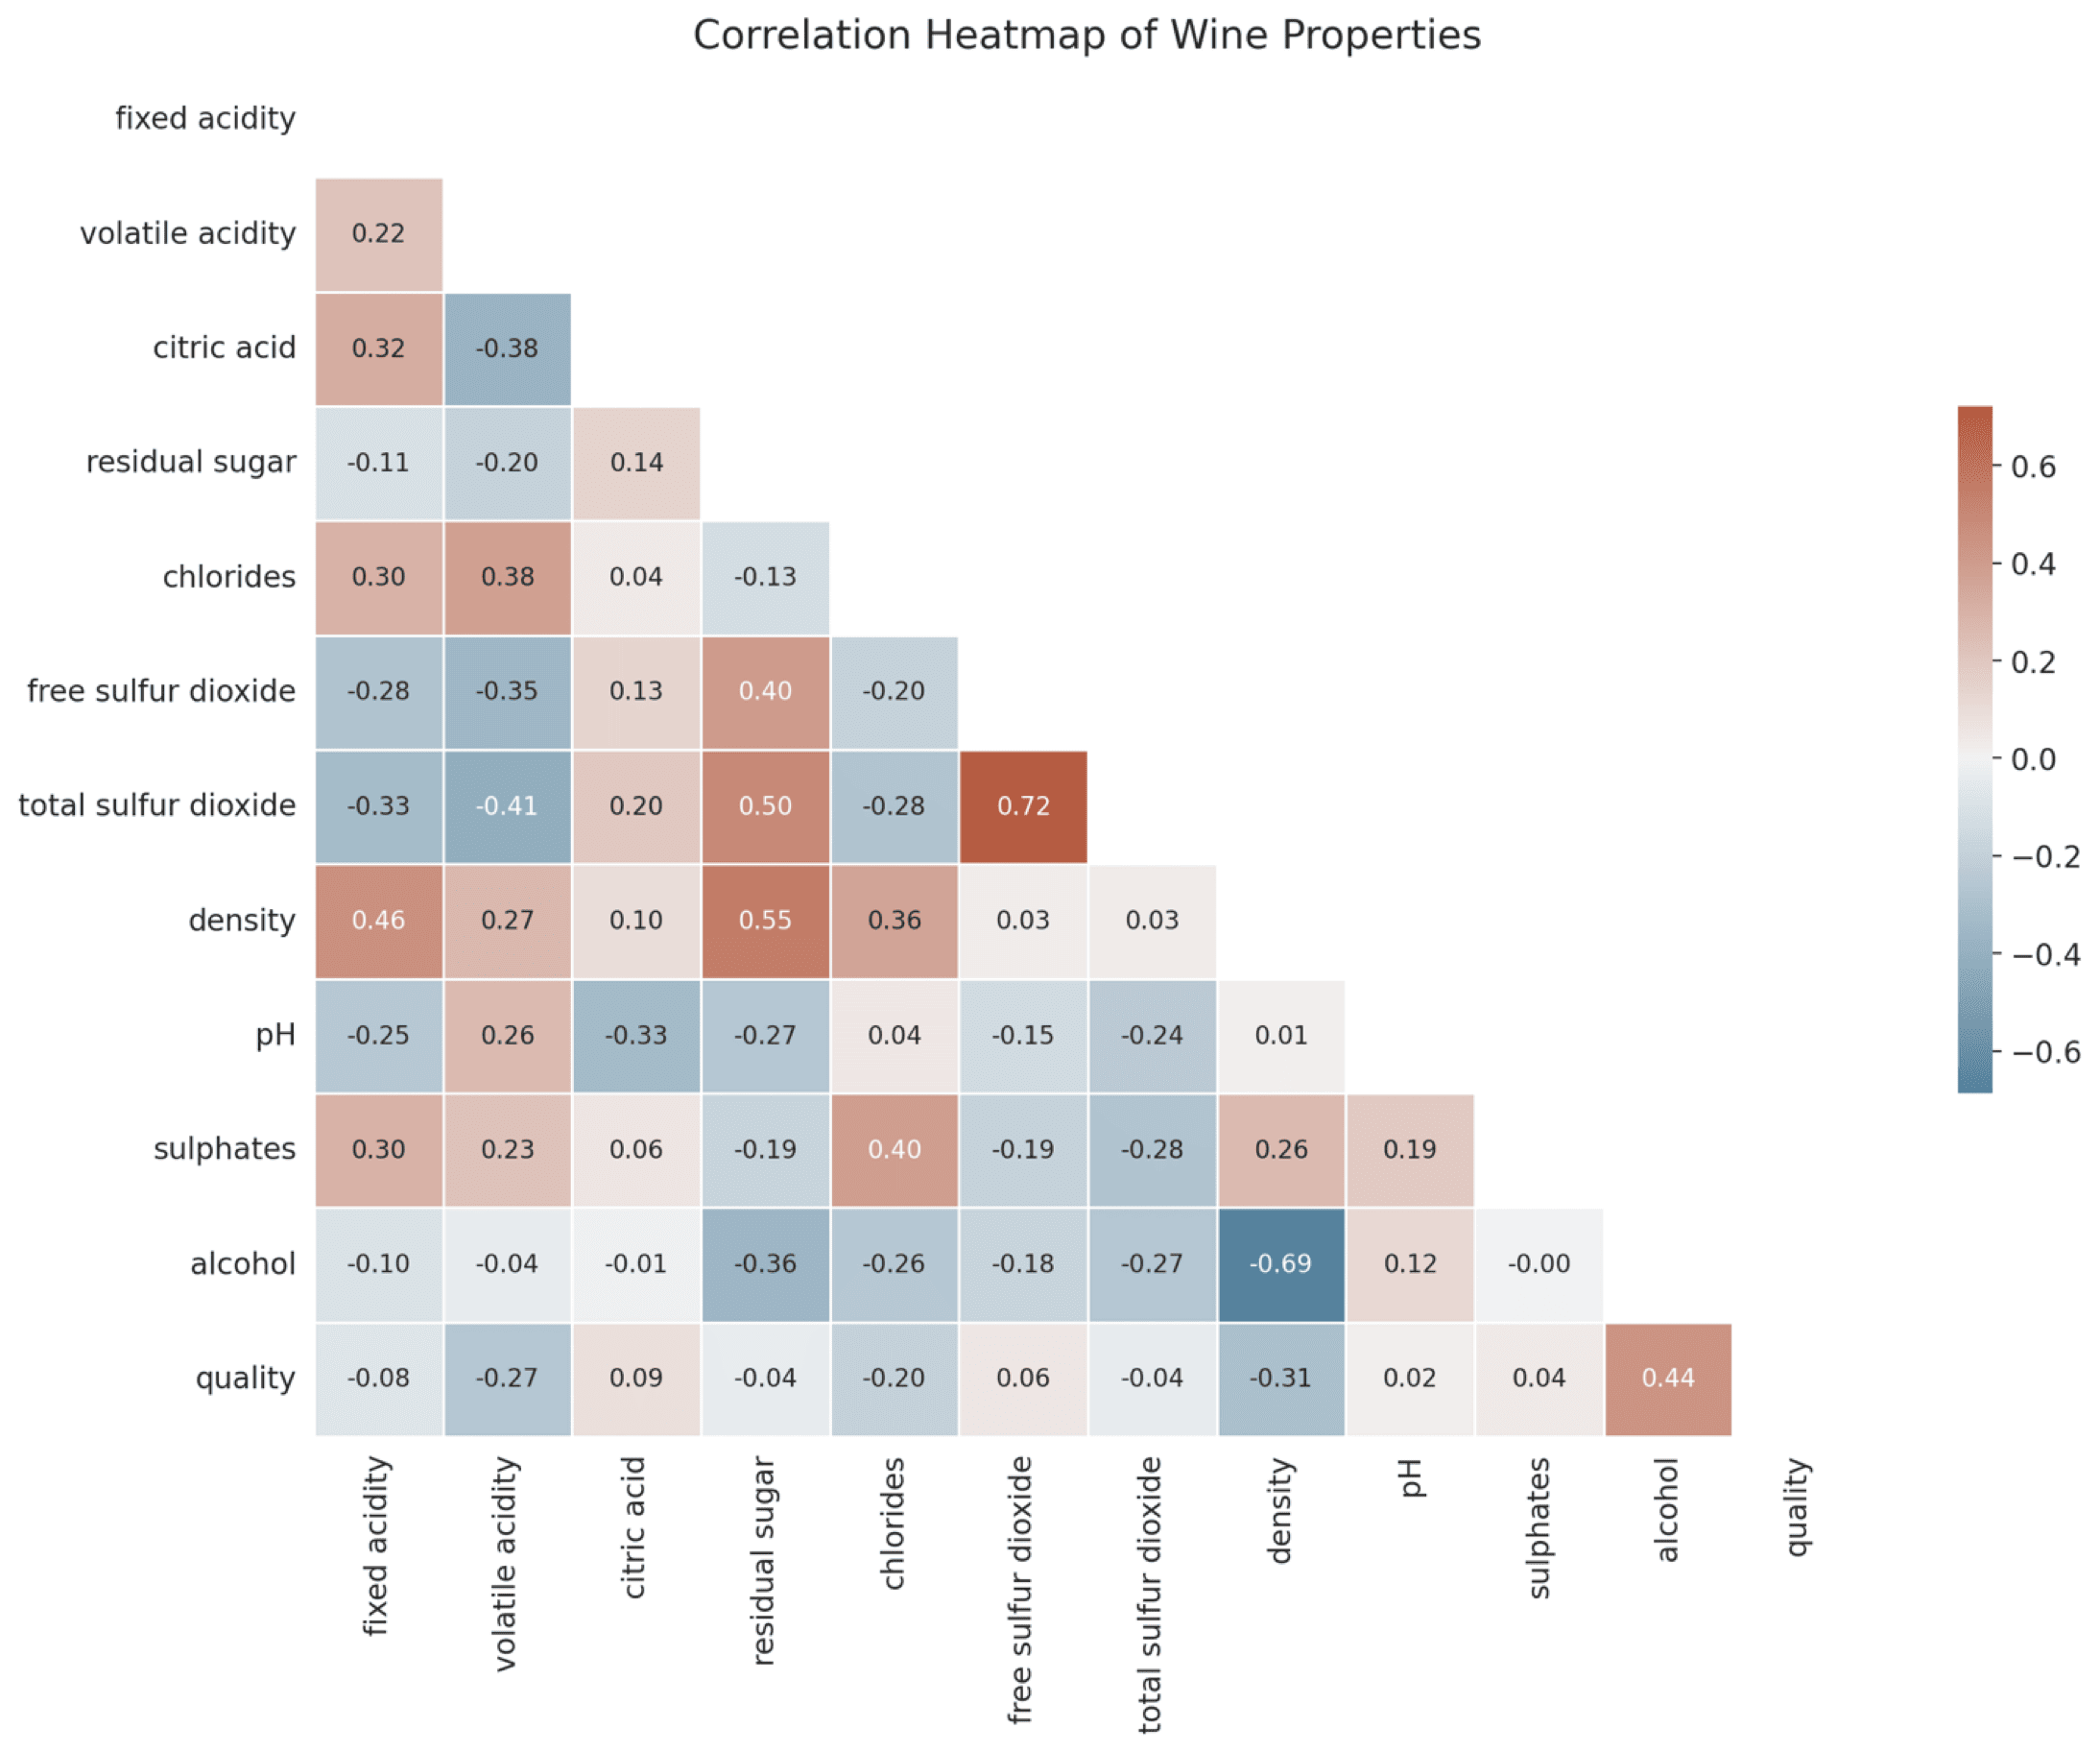
Here’s the correlation heatmap of the wine properties. From the heatmap, we can observe that:
- The alcohol content has a relatively strong positive correlation with the quality of the wine. This observation aligns with our earlier analysis where we noticed that higher-quality wines generally contain more alcohol.
- The density of the wine has a somewhat strong negative correlation with the quality of the wine. This suggests that higher-quality wines tend to have a lower density.
- The volatile acidity also has a negative correlation with the quality of the wine, implying that better-quality wines tend to have lower volatile acidity.
- There are also some strong correlations between different properties of the wine, which are not directly related to the quality. For example, density has a strong positive correlation with residual sugar.
This is when I had to jump onto a meeting in zoom, so I hit pause.
Let me just add that all this took just 20 minutes, maybe less.
I am still trying to wrap my head around this. But the possibilities appear endless and I am constrained by nothing but my imagination.


0 Comments