
There was a recent query on the PhD-Design-List regarding sources for designers on how to make good info-graphics and data-visualizations. I am collating the options being put forward by people here, just for the record.
- Manuel Lima’s work
- The book: Visual Complexity: Mapping Patterns of Information | The website: http://www.visualcomplexity.com/vc/
- Edward Tufte’s books (Website)
- Data Flow: v 2 by Robert Klanten N. Bourquin and S. Ehmann
- Information is Beautiful by David McCandless | Website: http://www.informationisbeautiful.net/
- Visual Storytelling: Inspiring a New Visual Language by Robert Klanten, S. Ehmann and Franz Schulze
- Primer of Visual Literacy, by Donis A. Dondis
- Flowing Data Website | Book Visualize This: The Flowing Data Guide to Design, Visualization, and Statistics
- Infosthetics Website
- Information Visualization Links maintained by System Orientated Design (An excellent resource (quite a bit of overlap with this list but lots of unique resources as well)
- List of Open Source Graphics and Visualization Tools maintained by Karl Gude at Michigan State University.
I will be adding to this list as people post more sources.
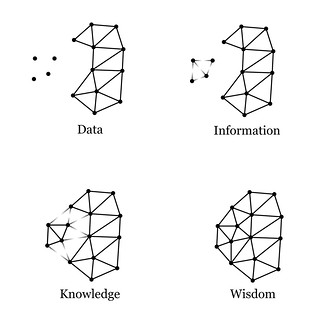
Image: Data, Information, Knowledge, Wisdom 0.1 Image by MichaelKreil (from Flickr)

0 Comments